Today, we’re excited to share a preview of what we’ve been building at Config. Our mission is to make robots capable of reliably performing two-handed tasks across diverse real-world settings materially more cost- and time-efficient to deploy.
Our work is guided by two core beliefs:
[1] The primary bottleneck for general-purpose robot foundation models is data—not merely more data, but data with sufficient richness and diversity to enable real-world generalization across tasks, objects, and environments.
[2] Robot embodiments will vary by use case and cost, particularly at the end-effector level (e.g., grippers or hands). In practice, the “right” robot is the one that is both effective and economically viable for the target application.
To address the problem [1] in a way that remains robust under the hypothesis [2], we built our product (see our Product page for an overview). At a high level, our system is designed to enable rapid adaptation to new tasks and target robots. Fig. 1 illustrates this end-to-end workflow:
Figure 1. Config’s rapid task-specific model deployment: CFG-1, our foundation model pretrained on large-scale human action data, is adapted to a target task using a small amount of teleoperation data. Iterative improvement through online rollouts and strategy refinement then closes the loop, enabling task-specific policy deployment within approximately 48 hours.
Figure 1. Config’s rapid task-specific model deployment: CFG-1, our foundation model pretrained on large-scale human action data, is adapted to a target task using a small amount of teleoperation data. Iterative improvement through online rollouts and strategy refinement then closes the loop, enabling task-specific policy deployment within approximately 48 hours.
The system illustrated in Fig. 1 is built on two core ideas:
1. Start with humans to scale action data quickly and economically.
Rather than relying solely on robot teleoperation—which is expensive and operationally heavy to scale—we use human-performed actions as the primary source of training signals, enabling efficient collection of large-scale data of quality (see Fig. 2 below; to date, we’ve collected ~100k hours of human action data).
Figure 2. Data throughput (hours & task scenario numbers): Through our in-house data pipeline, we currently collect approximately 20k hours of action data per month.
Figure 2. Data throughput (hours & task scenario numbers): Through our in-house data pipeline, we currently collect approximately 20k hours of action data per month.
This dataset is used to train CFG-1, our first-generation pretrained foundation model for bimanual manipulation:
Figure 3. CFG-1: our first-generation robot foundation model is based on an autoregressive architecture that maintains a long-horizon memory to capture holistic task context, while leveraging a relatively short sliding window of recent frames to ensure high-precision action prediction
Figure 3. CFG-1: our first-generation robot foundation model is based on an autoregressive architecture that maintains a long-horizon memory to capture holistic task context, while leveraging a relatively short sliding window of recent frames to ensure high-precision action prediction
As we scale throughput of the data, we prioritize its quality, which is defined by both precision and accuracy of action, as well as diversity across tasks, environments, and objects.
Since raw human video lacks structured control signals, precise action labeling is essential for downstream model quality. To address this, we design and fabricate a human-operated hand gripper that mimics the target robot’s end-effector, along with a pipeline that estimates robot-aligned action representations from gripper trajectories in human-performed manipulation. Video 1 below qualitatively demonstrates the accuracy of the estimated 7-DoF robot-aligned action representations of both end-effectors across diverse human-performed task data:
Video 1. Visualization of estimated 7-DoF robot-aligned actions from human-performed tasks: The left panel shows the raw human task video, while the right panel visualizes the reconstructed trajectories of both end-effectors derived from the estimated robot-aligned action representations.
Video 1. Visualization of estimated 7-DoF robot-aligned actions from human-performed tasks: The left panel shows the raw human task video, while the right panel visualizes the reconstructed trajectories of both end-effectors derived from the estimated robot-aligned action representations.
To ensure data diversity, we systematically broaden variations in environments, objects, and actions during data collection for each target task. Each "scenario" (Fig. 2) represents a distinct variation of that task. Video 2 showcases our internal explorer and the diverse scenarios created to date:
Video 2. 3D embedding visualization of scenarios: We apply UMAP to project 1,536-dimensional scenario instruction embeddings (generated with text-embedding-3-small from OpenAI) into a 3D space. Clusters are identified via HDBSCAN, and marker sizes reflect the total data collection duration per scenario.
Video 2. 3D embedding visualization of scenarios: We apply UMAP to project 1,536-dimensional scenario instruction embeddings (generated with text-embedding-3-small from OpenAI) into a 3D space. Clusters are identified via HDBSCAN, and marker sizes reflect the total data collection duration per scenario.
2. Adapt the foundation model to a target robot with focused teleoperation data—then improve it in a closed loop.
We then finetune our foundation model for a specific target robot through an automated end-to-end pipeline—spanning data collection to model training and evaluation—typically completed within 24 hours.
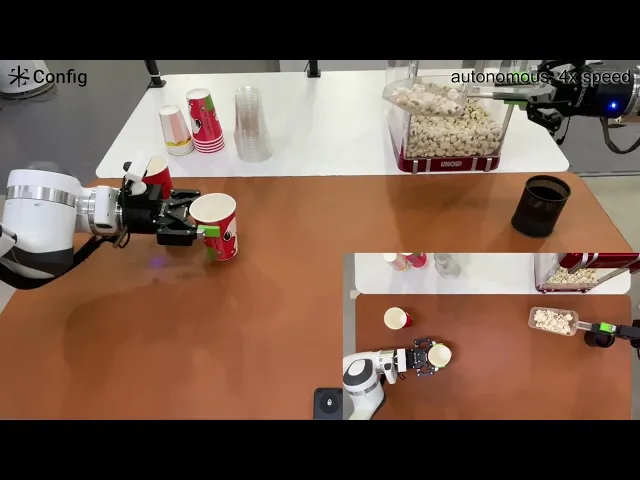
The process begins with designing a data acquisition strategy informed by the target robot’s physical characteristics and sensing constraints to enable efficient model learning, followed by collecting a small amount of target task-specific teleoperation data and finetuning the model. The model is then improved through online rollouts, iteratively refining both the data strategy and policy performance. Fig. 4 illustrates this closed-loop process on a popcorn-serving task:
Figure 4. Rapid, iterative improvement of a policy on the popcorn-serving task: Success rate is the mean of binary success/failure outcomes over thirty model inferences. Error bars denote the standard error of the mean for a binomial process.
Figure 4. Rapid, iterative improvement of a policy on the popcorn-serving task: Success rate is the mean of binary success/failure outcomes over thirty model inferences. Error bars denote the standard error of the mean for a binomial process.
For the instruction “Serve popcorn in a cup,” we initially adopted the scoop-holding strategy shown in Video 3. This approach did not produce a strong initial policy (see the orange bar in Fig. 4). We attribute this primarily to two factors: (1) the data acquisition strategy did not allow the model to effectively leverage the wrist-view for fine control of the scoop position relative to the cup, and (2) the model may have learned spurious noise from arm instability caused by the teleoperator maintaining an unnatural pose while holding the scoop.
After evaluating the model fine-tuned on 100 trajectories collected using this first strategy, we revised the scoop-holding method (Video 4). This change highlighted the importance of an effective data acquisition strategy: the updated policy achieved a significantly higher task success rate of 43% (± 9%). This iteration — from data collection to evaluation — was completed within a single day using our pipeline.
Once an effective data strategy is identified, we provide a visual guideline (e.g., reference video) for data collectors to follow during online data collection. This structured guidance reduces unnecessary variance in action trajectories (see Fig. 5 below) and improves the efficiency of subsequent model finetuning.
Figure 5. Pairwise DTW distribution comparison: We compute pairwise Dynamic Time Warping (DTW) distances between end-effector cartesian position trajectories, (x, y, z) for all unique episode pairs within each dataset (N = 30 sampled episodes, subsampled to ∼18 frames/episode). DTW finds the minimum-cost elastic alignment between two sequences by warping the time axis, making it robust to variations in episode speed or duration unlike fixed-frame L2 distance. The y-axis reports probability density — the histogram is normalized to unit area — so the two datasets remain directly comparable regardless of differences in episode count. Lower DTW distances achieved with the 2nd, refined strategy indicate greater consistency in spatial trajectories across episodes.
Figure 5. Pairwise DTW distribution comparison: We compute pairwise Dynamic Time Warping (DTW) distances between end-effector cartesian position trajectories, (x, y, z) for all unique episode pairs within each dataset (N = 30 sampled episodes, subsampled to ∼18 frames/episode). DTW finds the minimum-cost elastic alignment between two sequences by warping the time axis, making it robust to variations in episode speed or duration unlike fixed-frame L2 distance. The y-axis reports probability density — the histogram is normalized to unit area — so the two datasets remain directly comparable regardless of differences in episode count. Lower DTW distances achieved with the 2nd, refined strategy indicate greater consistency in spatial trajectories across episodes.
By the following day, we conduct multiple rounds of online data collection and policy training, progressively refining the model with each cycle. This online data-collection approach, leveraging policy rollouts from previous rounds, naturally increases state diversity by allowing human experts to recover from the model’s suboptimal actions and failures, as shown in Fig. 6 below:
Figure 6. End-effector cartesian position (x, y, z) coverage across iterative data collection rounds: We visualize the 3D workspace coverage of each end-effector across iterative data collection rounds by plotting the raw Cartesian position (x, y, z) of the left and right arms sampled from all episode frames. Points are trimmed to within ±2σ of each round's centroid to suppress outliers, and 10% of the remaining frames are randomly subsampled for legibility. Each color represents one round of data collection, revealing how the covered workspace expands as human interventions guide the robot into previously unvisited regions.
Figure 6. End-effector cartesian position (x, y, z) coverage across iterative data collection rounds: We visualize the 3D workspace coverage of each end-effector across iterative data collection rounds by plotting the raw Cartesian position (x, y, z) of the left and right arms sampled from all episode frames. Points are trimmed to within ±2σ of each round's centroid to suppress outliers, and 10% of the remaining frames are randomly subsampled for legibility. Each color represents one round of data collection, revealing how the covered workspace expands as human interventions guide the robot into previously unvisited regions.
After two rounds of online data-driven model improvement, the task success rate improved to 76% (± 7%). The resulting policy can be seen in Video 5.
Video 4. The second, refined data strategy
Video 3. The first data strategy
Video 3. The first data strategy
Video 4. The second, refined data strategy
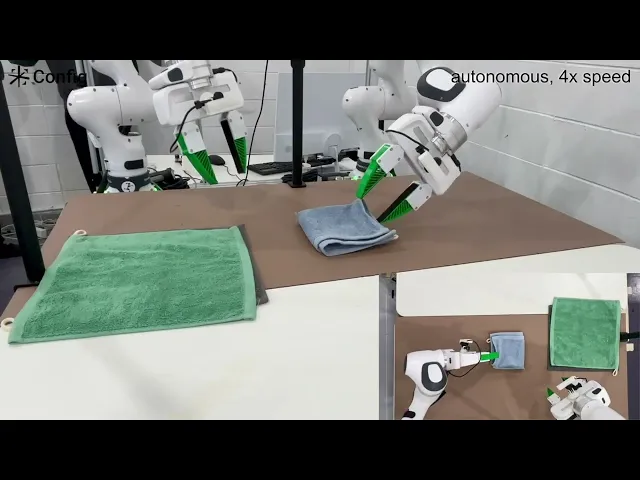
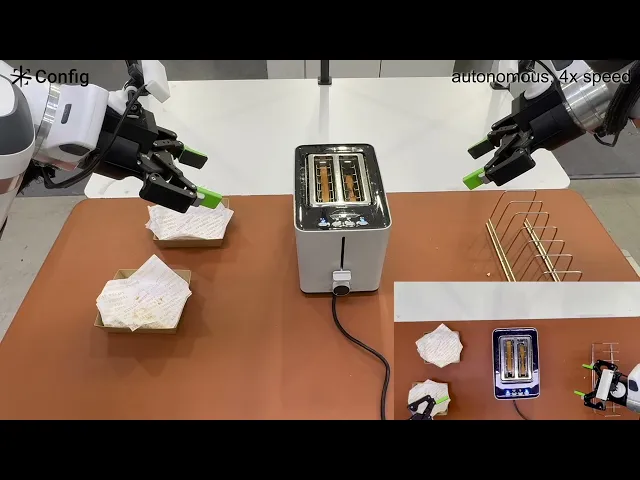
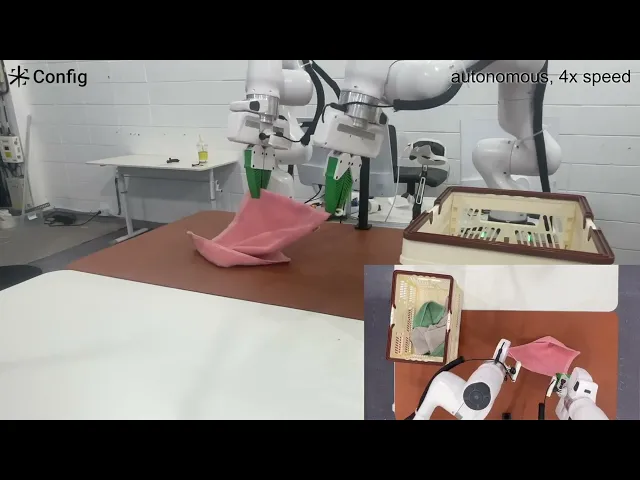
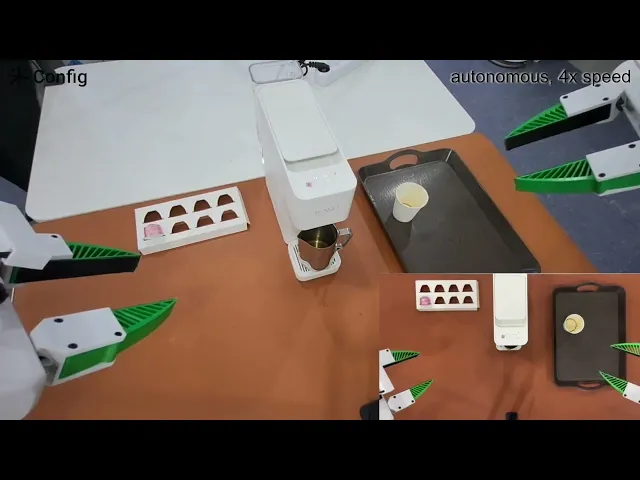
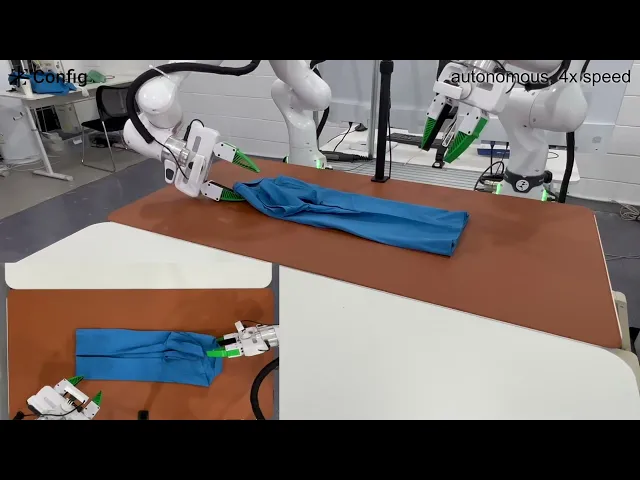
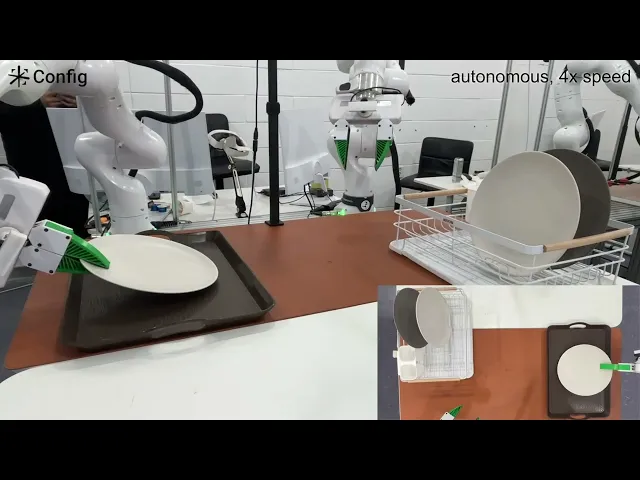
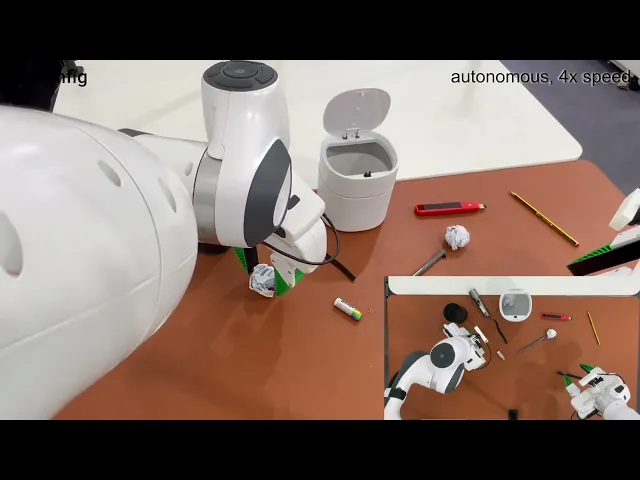
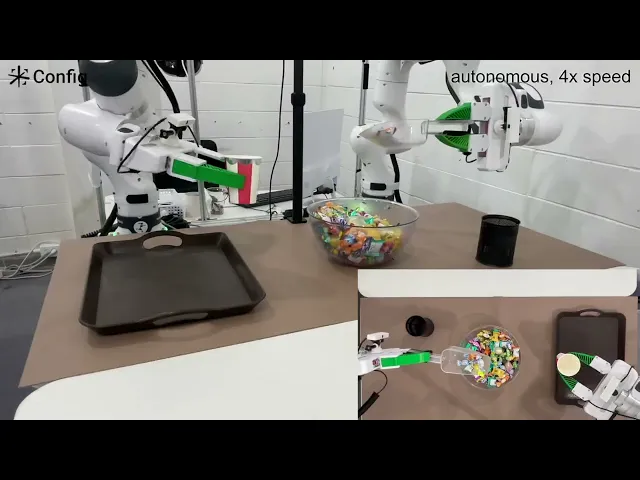
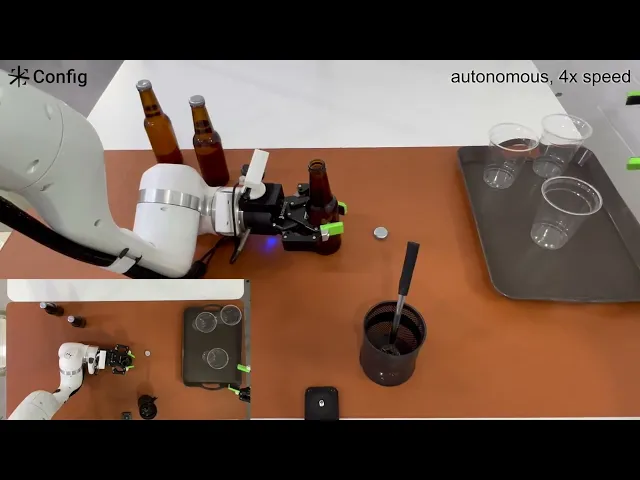
Check out the videos below to see how our models perform across a range of additional tasks, showcasing the promise of our approach.
Stay tuned for more updates — including our own models and datasets — coming soon. Follow us on X and YouTube to stay up to date with our latest work.